Hello again! It's been ages since the last post... Anyway, today is an update on my research project and the life as a Masters student battling with software and variable motivation. I've tried to put links to all the sciency bits to help explain.

This little piece of rock is roughly 4.6 billion years old. That's 4,600,000,000 years. It's a type of meteorite known as a 'howardite', which are made from the broken pieces of lots of rocks. I bought it from eBay, which according to my adviser is one of the best places to buy samples from. This particular one is NWA 1929, and is officially cataloged here. It weighs less than a gram, but I still think it's pretty cool.
Now, why did I buy it?
Well, that's because I'm doing an independent research project for my final year of my MGeol degree. Oh, MGeol is an integrated geology masters. The focus of my research is working out what sort of rocks there might be on Vesta. In particular, I'm looking at eucrites (pretty much space basalt) with a scanning electron microscope to analyse the minerals and textures in super high detail.
First of all though, let's have a quick run-down on Vesta.
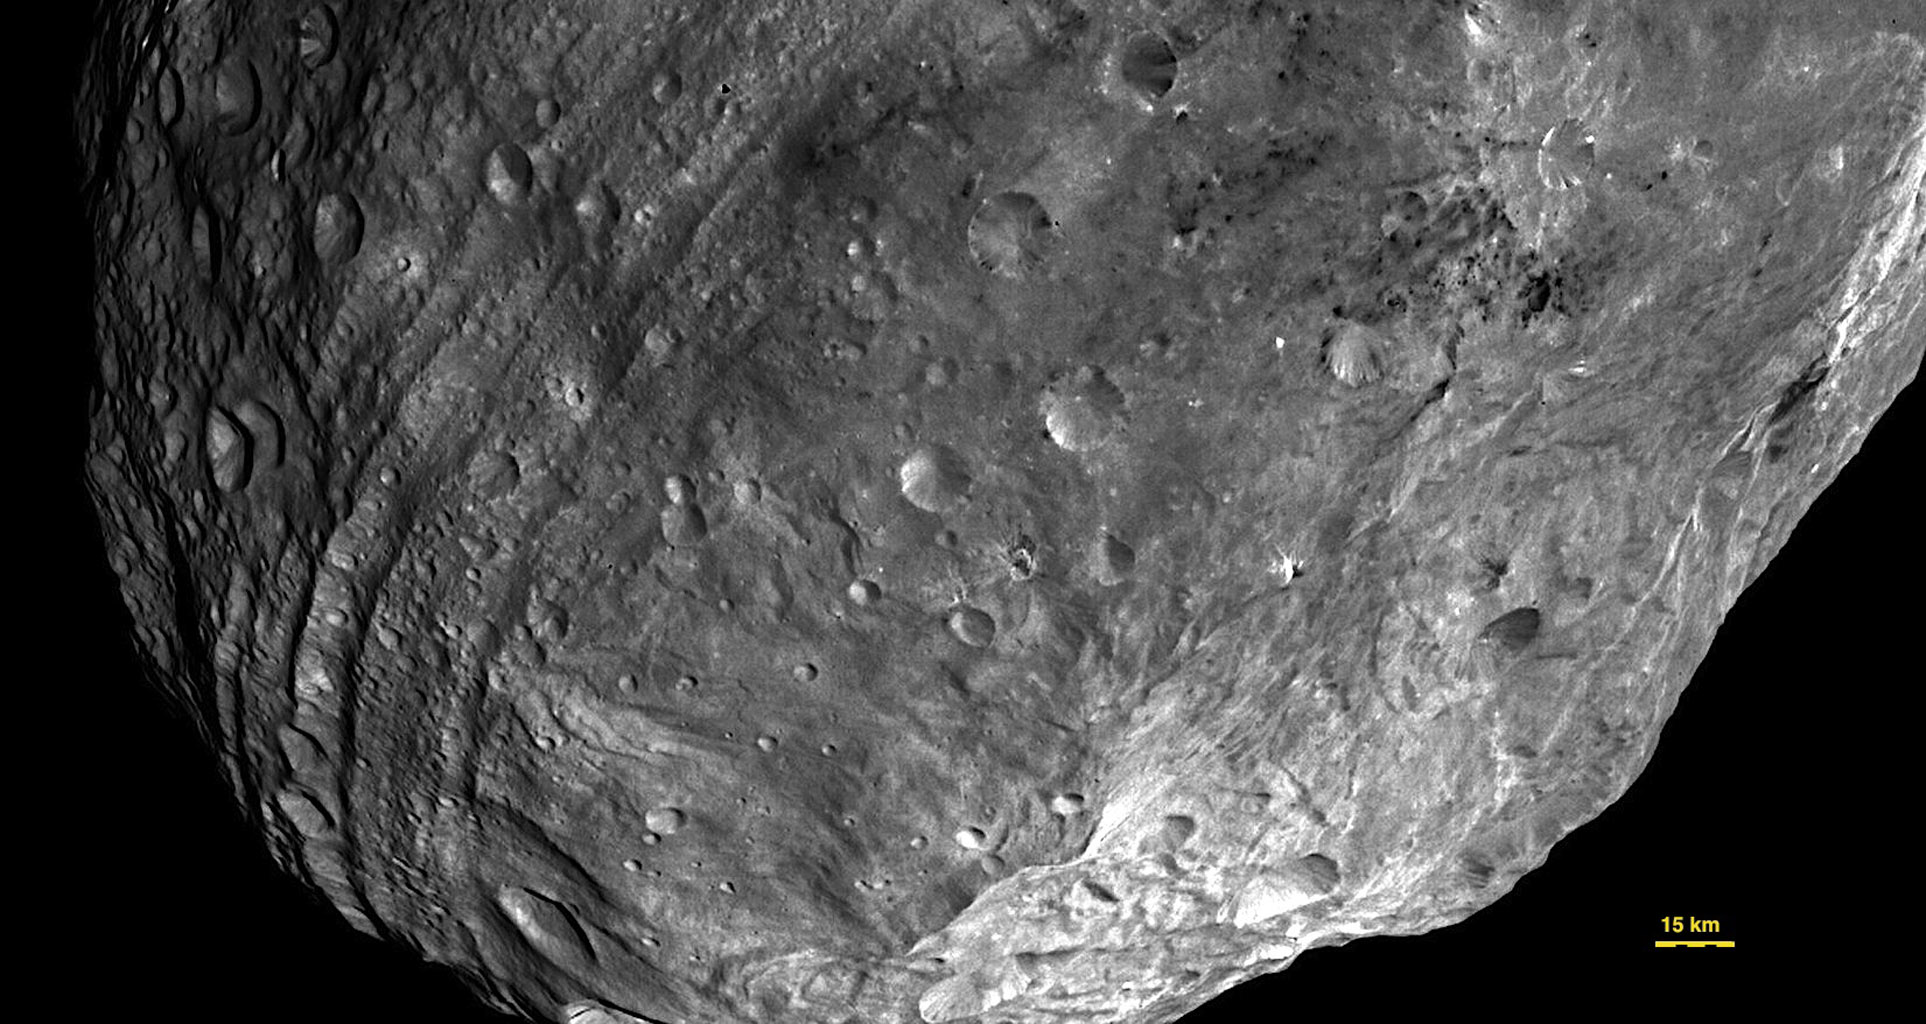
Vesta is a proto-planet in the asteroid belt, and was first discovered in 1807. It is 'differentiated', meaning that it was able to form a crust, mantle, and core - just like Earth.

However, it never made it to being a proper planet, and now hurtles around the Sun once every 1,325 days. Vesta is thought to be the parent body for many HED meteorites. These are all igneous rocks, similar to basalts and gabbros on Earth. These meteorites were launched from the surface of Vesta by impacts from other bodies in the asteroid belt, particularly in the Rheasilvia Basin at the south pole of Vesta. This basin is a 500km impact crater that gives Vesta a bit of a funny shape at the bottom.
Anyway, NASA launched the Dawn mission in 2007, which arrived at Vesta in 2011 and orbited for a year or so before moving onto Ceres. Currently, Dawn is here.
Dawn was able to send back a load of data, including images, infra-red, and gamma ray data. From that, scientists have been able to make a rough geological map of Vesta, as well as studying the various craters, rock types, structural features, and think about how it formed.
If you fancy it, there is a load of scientific literature available on all of Dawn's data. I recommend ScienceDirect or Google Scholar as an easy to find things to read, but just be warned that a lot of papers are behind a paywall, so you might only be able to access the abstracts or view it simply on the webpage. At the very least, take a look at NASA's website for the Dawn mission. There are loads of photos, nicely explained science, regular updates, and videos.
Right. Back to my project.

Like I said, I'm using scanning electron microscopy (SEM) to study what each meteorite sample is made from in terms of elements, and then minerals. It's been good fun so far, but there's been a few problems too.
Step 1. Sample Prep
Most of my samples came as thin sections - 0.03mm slices of rock stuck to a glass slide for use in microscopes. The benefit of thin sections is that they can go straight into the SEM after they've been coated in a thin layer of carbon and stuck down with copper tape, like this...

Some of my samples came as little chunks of rock like the one right at the start of this post. These ones have to be put into resin and polished by hand and by machine using various diamond pastes. This takes much longer than I'd like it to. Once they're all nice and shiny, the resin blocks are coated in carbon and can be used in the microscope.
Step 2. Data Collection.
Data collection is probably the easiest bit, actually. Driving the microscope is really good fun, and it's nice to see images and data in real time, rather than having to wait hours. You start off by finding an interesting looking area and spending what feels like 3 days of your life focusing the microscope. I'm using a JEOL 5001 FEG SEM, which can go up to over 1 million times magnification, although I rarely go about 850x.
To start with, you get an EBSD image. This gives you a black and white picture of the sample, and can be used to look at texture and topography.

Different minerals show as different shades of grey, which is useful for the next stage of analysis.
Once you have your EBSD image, you wheel yourself across to the next computer to start analysing the composition. I'm using software called AZtec, which is only occasionally infuriating. Anyway, once you tell it to start mapping the area you've selected, you end up with something like this...

And yes. The colour schemes will always be hideous.
From there, you can run all the analysis you need to, and save several tens of gigabytes to your hard-drive and you're done! You can also make lots of spectral graphs, which are useful for telling you how much of each element there is.
Occasionally I get to run maps of the whole sample overnight or over the weekend which gives massive file sizes, but a really good representation of what your sample looks like. This is one of Millbillillie, which I affectionately refer to as Millie.

I got lucky with the colour scheme on that one. Never been able to replicate it.
Step 3. Analyse that shit!
Right. You've got your images and your data. You've exported it in every possible format. You've waited days for it to stick all the individual pictures together into one big picture. Good. Well done. Now it's time to make sense of all those numbers and spectra.
First things first, modal abundance. This is how much of each element there is in your sample. Now, AZtec will give you some numbers for this, but it's good to double check. You can do this in photoshop of all things. I downloaded a 30 day trial just to do this. It's highly frustrating and very bad for your eyes, but it seems to work well enough. As a bonus, sometimes you make really nice images that show certain things. For example, this one shows the texture of the sample really well. The stripey bits are caused by exsolution.

Spreadsheets are always fun. I have far too many of them now, but they are useful. The main thing I'm currently working on is identifying all the minerals that I've got spectral data for. I do this by looking at the ratios of different elements, and reconstructing them into formulas, and then into minerals. For example...

Now repeat several hundred times.
This is the stage I'm up to at the moment.
Step 3. Write the damn thing.
We're given a guideline of 10,000 words, but also told that it should be suitable for a relevant publication. This means that some people will write 2 sides of A4, others (like me) will be writing up to 30 pages or so.
Step 4. Presentation.
The final stage of my project is a small presentation to staff members about my project, and answering their questions. I'm probably the least stressed about this bit. I really enjoy presenting, and I really like my project. The key to a good presentation is being interested in what you're presenting.
So that's where I'm at. I've a few data sets that don't work properly - as in there are holes in the data and so on. That being said, I feel like I'm doing well and I'm on track at the moment. I struggle to get motivated sometimes, especially as I'm now just processing data and reading papers. I think it'll be fine.
That's fascinating and so cool :D The very idea of 'rocks from space' is already cool, I can understand your interest in the subject. Good luck with everything!
ReplyDelete